In the fast-paced world of global finance, data is the ultimate currency. Whether you are a macro trader, a corporate strategist, or a student of economics, having access to accurate, real-time data can be the difference between a winning strategy and a costly mistake.
Trading Economics has established itself as one of the most comprehensive “data-first” platforms on the internet. Unlike social-heavy charting tools, Trading Economics focuses on the raw numbers that drive global markets—GDP, inflation, interest rates, and trade balances. As we move through 2026, the platform remains a staple for those who need to look “under the hood” of the global economy.
What Is Trading Economics?
Trading Economics is a global financial platform that provides its users with more than 20 million economic indicators for 196 countries. Founded with the mission to provide high-quality data directly from official sources (such as central banks and national statistics offices), it serves as a bridge between complex economic reports and actionable market insights.
Platform Purpose
The site is designed to give users a transparent look at the world’s economic health. While many platforms focus solely on stock prices, Trading Economics excels in Macroeconomic Analysis. It provides the “Why” behind market movements by tracking the fundamental data points that influence central bank decisions.
Industry Relevance
The platform is frequently cited by major institutions and news outlets like Google Finance, Wikipedia, and Investopedia. It is considered a primary source for historical economic data and forecasts, making it an essential tool for institutional investors and academic researchers alike.
Key Features
Trading Economics offers a robust suite of tools that go far beyond a simple news feed:
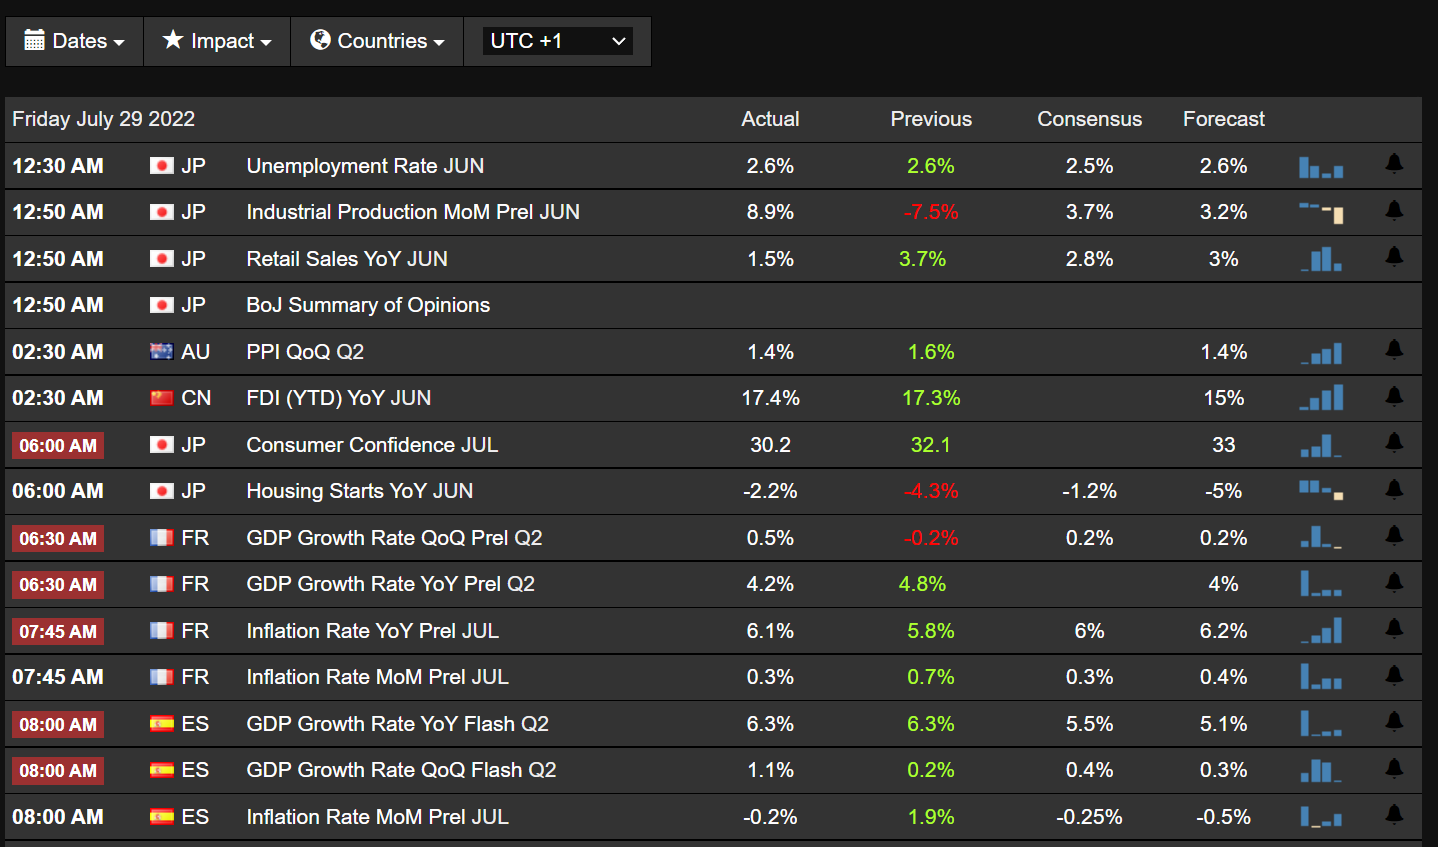
- Global Economic Calendar: One of the most detailed calendars available, featuring actual, previous, consensus, and forecast figures for every major economic release.
- Massive Indicator Database: Access to 20 million indicators including GDP, Unemployment, Inflation, and Interest Rates across nearly 200 countries.
- Historical Data & Charts: View and compare decades of historical data to identify long-term trends and cycles.
- Proprietary Forecasts: The platform provides its own predictions for economic indicators and markets, based on a combination of historical data and current trends.
- API & Excel Integration: For professional users, the platform offers an API and Excel Add-in to pull data directly into custom models or spreadsheets.
- Multi-Asset Coverage: While famous for economics, the site also provides live quotes for currencies, stocks, commodities, and government bonds.
Pros (Advantages)
✔ Official Data Sources: Unlike many sites that use third-party aggregators, Trading Economics pulls data directly from official government and central bank sources, ensuring high accuracy.
✔ Unrivaled Macro Coverage: If you need to know the industrial production of Vietnam or the debt-to-GDP ratio of Ghana, this is the place to find it.
✔ Customizable Comparison Tools: The ability to overlay different indicators (e.g., comparing US Inflation vs. Gold Prices) is incredibly intuitive and powerful for spotting correlations.
✔ Minimalist, Fast Interface: The website is built for speed and efficiency, lacking the heavy “bloat” found on many social-media-focused financial sites.
Cons (Disadvantages)
✖ Steep Learning Curve: For beginners, the sheer volume of data can be overwhelming. The site assumes a basic level of economic literacy.
✖ Price for Premium Features: While much data is free, advanced features like data exporting (CSV) and the Excel Add-in require a subscription that can be expensive for casual retail investors.
✖ Mobile App Experience: While the website is top-tier, the mobile app has historically received mixed reviews regarding its navigation and feature parity with the desktop version.
Key Points Summary
- Primary Strength: High-precision macroeconomic data and official statistics.
- Best For: Macro traders, economists, and data-driven researchers.
- Reliability: Extremely high; data is sourced directly from national agencies.
- Pricing: Free basic access; Professional tiers for data export and API usage.
Comparison: Trading Economics vs. The Competition
| Feature | Trading Economics | TradingView | Yahoo Finance |
| Core Focus | Macroeconomic Data | Technical Analysis/Charting | News & Retail Portfolio |
| Best For | “The Why” (Fundamentals) | “The How” (Price Action) | “The What” (Current Prices) |
| Data Sources | National Agencies/Banks | Exchanges/Aggregators | Exchanges/Partners |
| Social Features | Low | High | Medium |
| Complexity | High | Medium | Low |
While TradingView is the gold standard for drawing trendlines and social trading, it lacks the deep macroeconomic history found here. Yahoo Finance is excellent for a quick glance at your stock portfolio, but it doesn’t offer the rigorous data export capabilities required by professional analysts.
FAQ Section
Q1: Is Trading Economics free to use?
A: Yes, much of the data and charting on the website is free to access. However, exporting data to CSV/Excel or using their API requires a paid subscription.
Q2: How often is the data updated?
A: Data is updated in real-time as soon as official reports are released by national statistics offices or central banks.
Q3: Can I trade directly on Trading Economics?
A: No, Trading Economics is a data and analysis platform, not a brokerage. You use the data here to inform trades that you execute on your own trading platform.
Q4: Is Trading Economics reliable?
A: Yes. Because they source data directly from official institutions rather than third-party providers, they are considered one of the most reliable sources of economic data globally.
Conclusion
Trading Economics remains an indispensable resource in 2026. It is not a platform for those seeking “hot stock tips” or a social community. Instead, it is a professional-grade tool for those who believe that numbers tell the true story.
Who should use it?
- Macro Traders who need to track global interest rate cycles.
- Data Scientists who require historical economic datasets.
- Serious Investors who want to verify the “fundamentals” before following a trend.
Who should look for alternatives?
- Beginner Day Traders who only care about technical indicators and chart patterns (TradingView would be better).
- Casual Investors who just want to see if their stocks are up or down today (Yahoo Finance is sufficient).
Overall Rating: 9/10 (For Macro/Fundamental Analysis)
SEO Tags
Trading Economics Review, Economic Calendar 2026, Macroeconomic Data, Global Financial Indicators, Trading Economics vs TradingView


