Investing in the stock market can often feel like trying to read a different language. Between complex balance sheets, P/E ratios, and discounted cash flow (DCF) models, the barrier to entry for fundamental analysis is high. Simply Wall St aims to break down that barrier by turning cold, hard financial data into beautiful, easy-to-understand infographics.
In this comprehensive 2026 review, we take a deep dive into the platform’s features, pricing, and overall value to help you decide if it’s the right tool for your investment journey.
Introduction
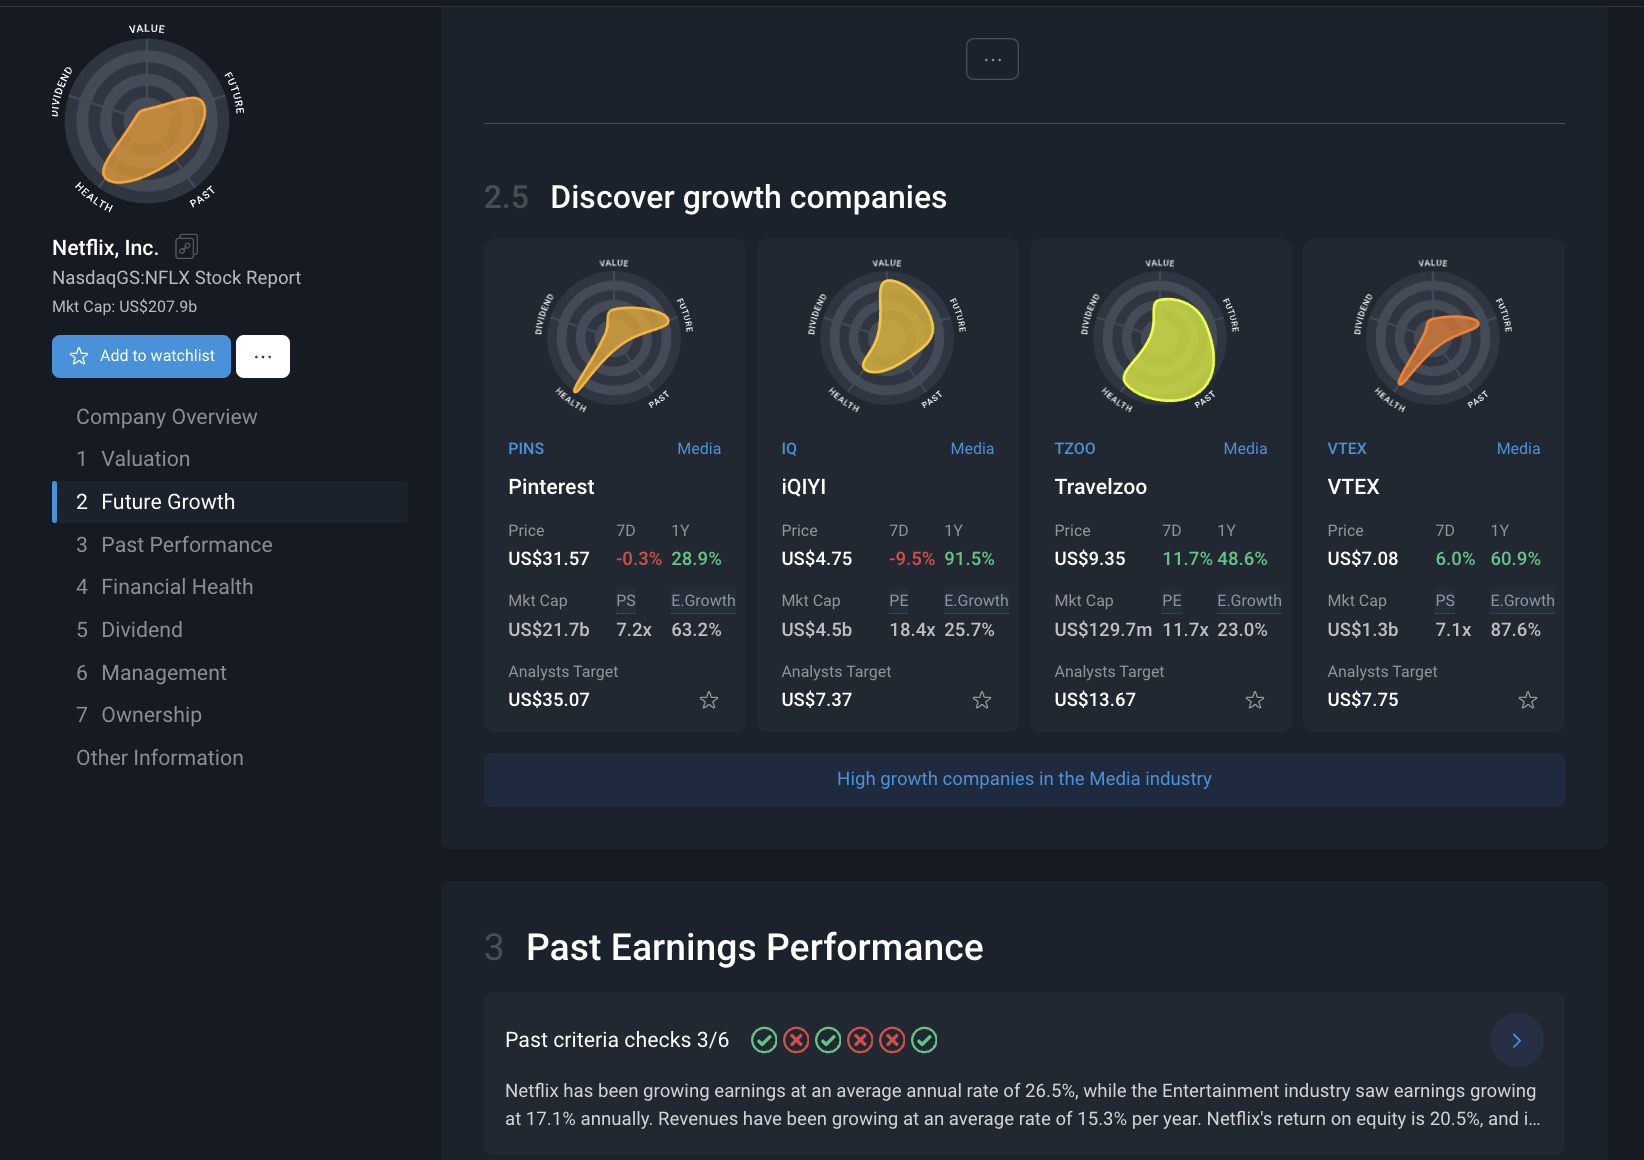
Simply Wall St is a visual-first stock analysis and portfolio management platform designed to simplify fundamental research. Instead of forcing users to dig through SEC filings or dense spreadsheets, the platform uses automated algorithms to analyze thousands of stocks globally and presents the findings through its iconic “Snowflake” diagram.
Designed primarily for long-term individual investors, Simply Wall St has gained massive popularity for making institutional-quality data from S&P Global accessible to the everyday retail trader. Whether you are a beginner looking to understand your first stock or a seasoned investor wanting a “command center” for your portfolio, this platform has likely crossed your radar.
What Is Simply Wall St?
Simply Wall St is a fintech platform that provides automated fundamental analysis for over 120,000 global stocks. Headquartered in Australia and trusted by over 7 million users worldwide, it bridges the gap between raw financial data and actionable insights.
Platform Purpose
The core mission of the site is to empower retail investors to make informed, non-emotional decisions. By focusing on five key areas—Value, Future Growth, Past Performance, Financial Health, and Dividends—the platform provides an instant health check on any ticker.
Target Users
- Visual Learners: People who prefer charts and infographics over data tables.
- Long-Term Investors: Those focused on fundamentals rather than day trading or technical analysis.
- Global Diversifiers: Investors looking for data on international markets beyond the NYSE or NASDAQ.
Industry Relevance
Simply Wall St is often cited alongside industry giants like Investopedia and Yahoo Finance. However, while those sites focus on news and education, Simply Wall St functions more like a “robo-analyst,” providing a standardized, objective framework for every company it covers.
Key Features
Simply Wall St is packed with tools that help you visualize data in ways other platforms don’t.
- The Snowflake Analysis: A visual summary of a stock’s strengths and weaknesses across five dimensions. The larger the “snowflake” in a specific area, the better the stock performs in that category.
- Portfolio Command Center: A central hub where you can link your brokerage account (supporting over 100 brokers) to track performance, risk, and diversification automatically.
- Narratives: A newer feature that allows you to build an investment thesis. It lets you adjust growth and risk parameters to see how they impact a stock’s “fair value.”
- Stock Screener: A highly visual filtering tool that lets you find “undervalued” companies, “dividend powerhouses,” or “insider buying” opportunities.
- Detailed Company Reports: In-depth pages covering executive compensation, ownership structure, and 10-year historical performance.
Pros (Advantages)
✔ Exceptional Visualization: The best-in-class UI turns complex data into intuitive graphics, saving hours of research time.
✔ Global Coverage: Access to detailed data on 120,000+ stocks across almost every global exchange.
✔ Brokerage Syncing: Seamlessly imports your actual holdings to provide a holistic view of your diversification and risk.
✔ Objective Analysis: Uses standardized S&P Global data, removing the “hype” often found in financial news.
Cons (Disadvantages)
✖ Not for Day Traders: The data is updated daily, not in real-time, making it unsuitable for high-frequency trading.
✖ Algorithmic Limitations: Because the analysis is automated, it can sometimes miss qualitative factors like a “moat,” management changes, or regulatory shifts.
✖ Limited Free Tier: The free version is restricted to 5 company reports per month, which can be limiting for active researchers.
Key Points Summary
- Visual Analysis: Uses the “Snowflake” diagram for instant stock health checks.
- Data Source: Relies on institutional-grade data from S&P Global.
- Focus: Fundamental analysis (Value, Growth, Health, Dividends).
- Portfolios: Supports automatic brokerage syncing and risk analysis.
Comparison Section: Simply Wall St vs. The Competition
| Feature | Simply Wall St | Yahoo Finance | TradingView |
| Primary Focus | Fundamental Visualization | News & Real-time Prices | Technical Analysis/Charting |
| Best For | Long-term Research | Quick Quotes & News | Active Trading & TA |
| Data Depth | High (Fundamental) | Medium | High (Technical) |
| Ease of Use | Very High | High | Moderate (Steep curve) |
While Yahoo Finance is great for a quick look at the day’s news and TradingView is the gold standard for drawing trendlines, Simply Wall St is the superior choice for understanding why a company might be a good long-term hold based on its books.
FAQ Section
Q1: Is Simply Wall St free to use?
Yes, there is a “Free Forever” plan that allows you to view 5 company reports per month and manage one portfolio. However, the Unlimited plan ($250/year) is required for full access.
Q2: How accurate is the “Fair Value” on Simply Wall St?
The Fair Value is calculated using a Discounted Cash Flow (DCF) model. While mathematically sound, it is based on analyst estimates of future growth. Investors should use it as a guide rather than a guaranteed price target.
Q3: Does Simply Wall St support crypto or bonds?
No. As of 2026, Simply Wall St remains focused exclusively on global equities (stocks).
Q4: Is Simply Wall St safe to link to my broker?
Yes. The platform uses secure, third-party integrations (like Salt Edge or Plaid) to sync data, meaning they never see or store your brokerage login credentials.
Conclusion
Simply Wall St is a powerful ally for the modern retail investor. It succeeds where many platforms fail: making the “boring” parts of investing—like analyzing balance sheets and cash flows—engaging and understandable.
Who should use it?
If you are a long-term investor who values clarity and wants a bird’s-eye view of your portfolio’s health without spending hours on spreadsheets, this is a must-have tool.
Who should look elsewhere?
Active day traders or those who rely heavily on technical indicators (RSI, MACD) will find the platform’s lack of real-time data and advanced charting restrictive.
Overall Rating: 4.5/5
SEO Tags
Simply Wall St Review, Stock Analysis Tools 2026, Fundamental Analysis Software, Portfolio Tracker, Simply Wall St Pricing


